Plot probability density intervals for fixed effects of brms models
Source:R/plot_intervals.R
plot_intervals.RdPlot probability density intervals for fixed effects of brms models
plot_intervals(brmsfit)Arguments
Value
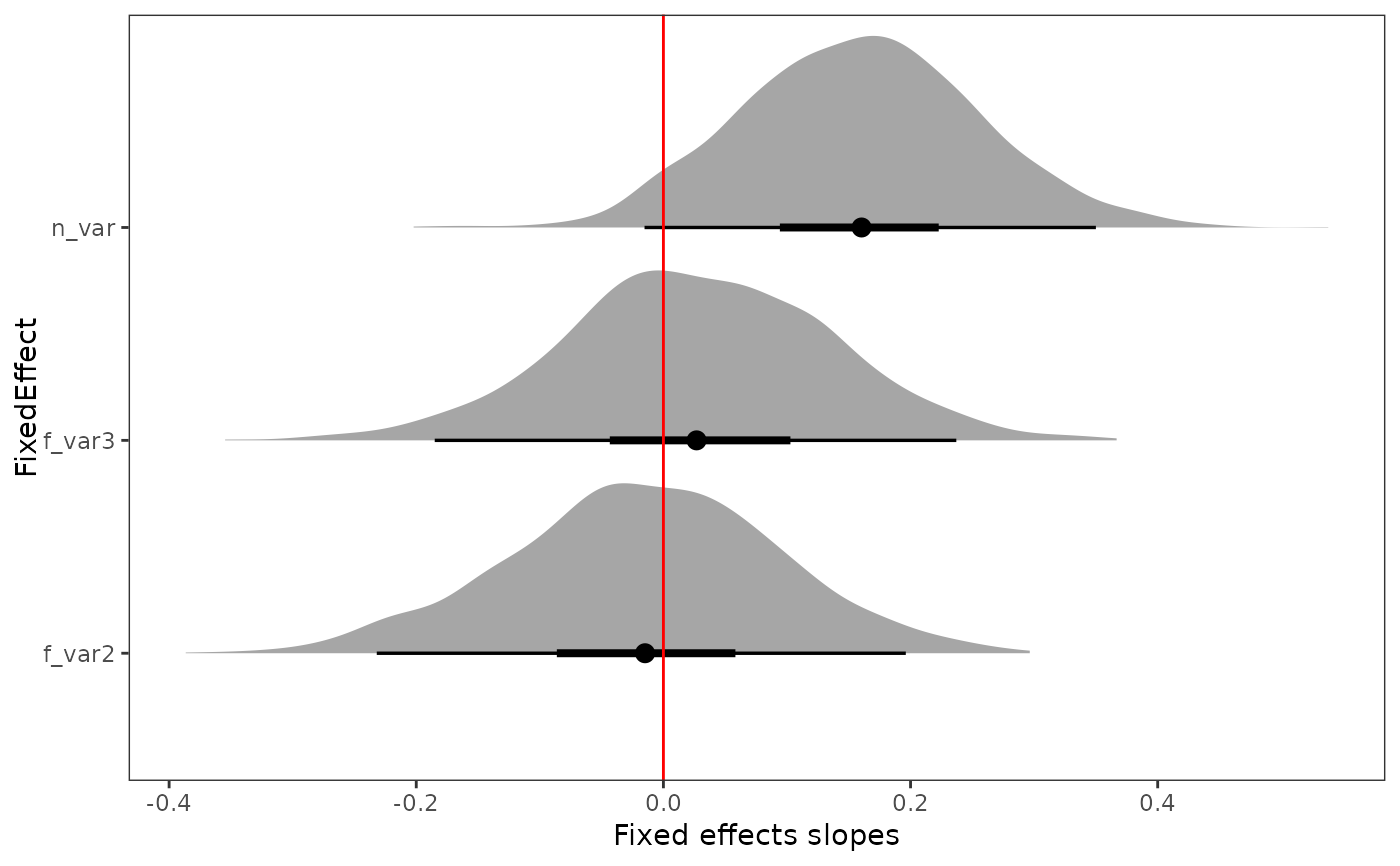
Returns a density plot with z-transformed fixed effect estimates.
Examples
# Simulate data
md = tibble::tibble(
  group = factor(sample(1:10, 1000, replace = TRUE)),
  f_var = factor(sample(1:3, 1000, replace = TRUE)),
  n_var = rnorm(1000, mean = 0, sd = 1),
  resp = rnorm(1000, mean = 10, sd = 3))

# Run model
mod = brms_model(Response = "resp",
                 FixedEffect = c("f_var","n_var"),
                 RandomEffect = "group",
                 Family = "gaussian",
                 Data = md)
#> [1] "No problems so far 😀"
#> Compiling Stan program...
#> Start sampling

# Plot fixed effects
plot_intervals(mod)
#> New names:
#> • `f_var` -> `f_var...1`
#> • `group` -> `group...3`
#> • `f_var` -> `f_var...4`
#> • `group` -> `group...5`