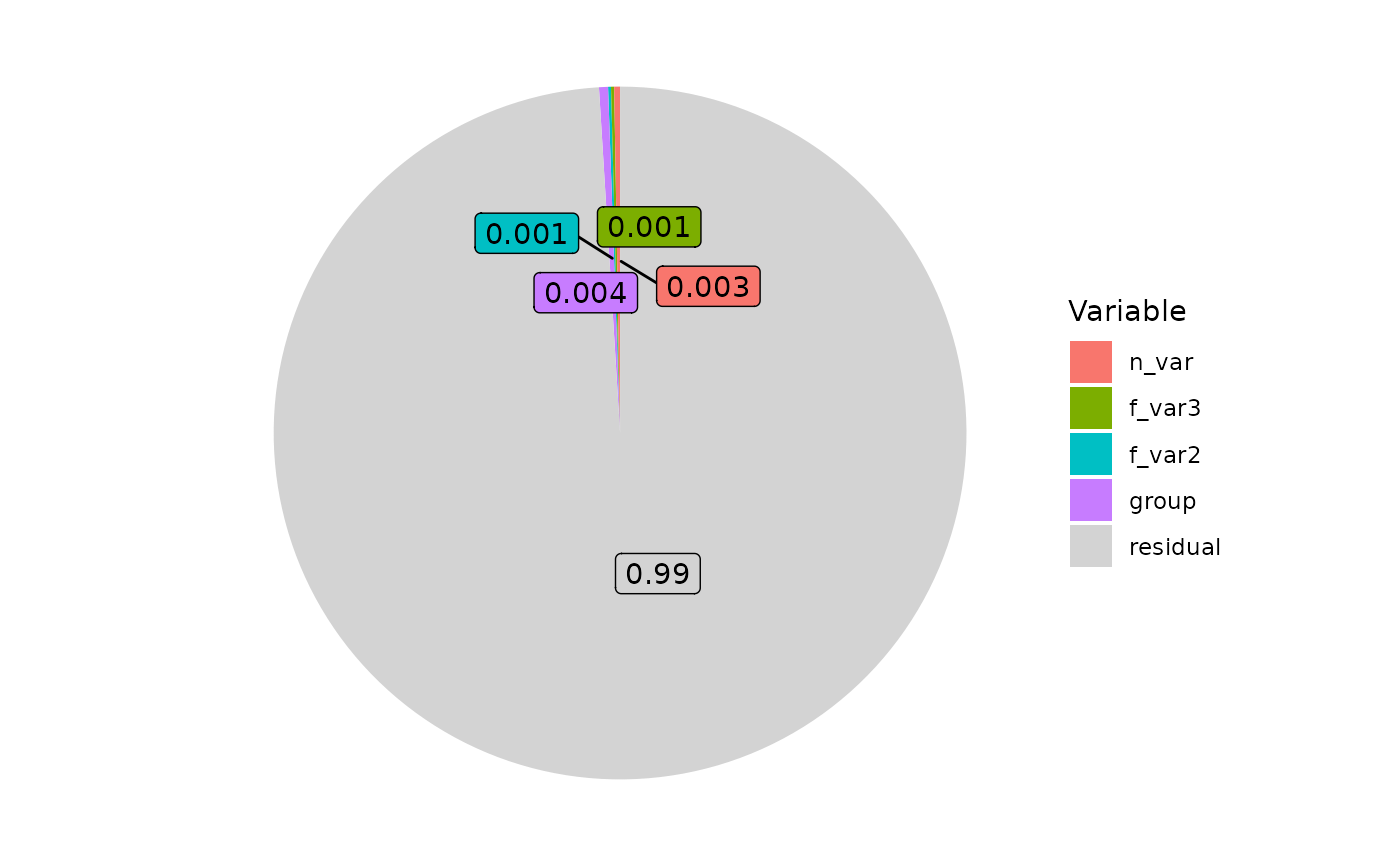
Plot R2 values of brms models
plot_R2(brmsfit, Colors = NULL, PlotType = "pizza", Label = NULL, Break = NULL)Arguments
- brmsfit
The output of a brms model. You can use VarDecomp::brms_model() to produce a brmsfit.
- Colors
A vector with string of the colors to be attributed to each variable ordered by R2, with residual at the end (e.g. c("blue", "green", "gray")).
- PlotType
Choose if the plot should be a 'bar' or 'pizza' plot.
- Label
Choose how values should be displayed ("box" or "text"). Default is set to not display values.
- Break
Add a break in the bar plot axis in cases where a variable explains a large portion of the variance.
Value
Returns a bar plot with the proportion of variance explained by each variable.
Examples
# Simulate data
md = tibble::tibble(
  group = factor(sample(1:10, 1000, replace = TRUE)),
  f_var = factor(sample(1:3, 1000, replace = TRUE)),
  n_var = rnorm(1000, mean = 0, sd = 1),
  resp = rnorm(1000, mean = 10, sd = 3))

# Run model
mod = brms_model(Response = "resp",
                 FixedEffect = c("f_var","n_var"),
                 RandomEffect = "group",
                 Family = "gaussian",
                 Data = md)
#> [1] "No problems so far 🐛"
#> Compiling Stan program...
#> Start sampling

# Plot R2
plot_R2(mod, PlotType = "pizza", Label = "box")